Application Note: Proteomic Profiling on Human Cerebral Spinal Fluid
Deep proteomic profiling of human cerebrospinal fluid by data-independent acquisition mass spectrometry coupled to bead-based protein enrichment.
Highlights
- Bead-based protein enrichment coupled to DIA mass spectrometry applied to human CSF on the Orbitrap Excedion Pro / Vanquish Neo UHPLC platform.
- Average 1.85 – fold increase in protein group identifications versus a matched non-enriched preparation from the same single donor specimens, reproducible across all eight donors.
- Differentially abundant proteins between high- and low-glucose strata define functionally distinct extracellular matrix / humoral immunity and neural projection / cell adhesion signatures.
Introduction
Cerebrospinal fluid (CSF) is the clear, low-protein biological fluid that surrounds the brain and spinal cord, occupying the cerebral ventricles and the subarachnoid space. Continuously produced by the choroid plexus and turned over several times daily, CSF provides mechanical cushioning of the central nervous system (CNS), supports metabolic homeostasis, and clears soluble waste from the brain parenchyma1. Because CSF exchanges directly with the brain extracellular fluid, its molecular composition reflects the state of the underlying neural tissue with a fidelity that peripheral fluids such as plasma cannot match. CSF analysis is therefore a cornerstone of laboratory diagnostics in neurodegenerative disease, CNS infection, intracranial hemorrhage, and primary or metastatic CNS malignancy2.
Despite its diagnostic value, characterization of the CSF proteome by liquid chromatography-mass spectrometry (LC-MS) has historically been technically demanding. The total protein concentration in CSF is roughly 0.2–0.8 mg/mL, approximately one percent of that of plasma, and the CSF proteome spans many orders of magnitude of abundance, with a small number of highly abundant carrier proteins (albumin, immunoglobulins, transferrin) suppressing detection of the lower-abundance signatures typically of greatest biological interest3. Classical strategies to address these challenges include extensive offline peptide fractionation, immunoaffinity depletion of high-abundance proteins, and pooling of large sample volumes which improve depth but increase per-sample cost, reduce throughput, and limit applicability to clinically realistic, single-donor specimens4.
Recent advances in MS-based proteomics have substantially improved the sensitivity, throughput, and reproducibility of single-shot CSF analysis. Faster-scanning Orbitrap instrumentation, novel data-independent acquisition (DIA) strategies, and advanced spectral library search algorithms now permit reproducible, quantitative profiling of complex biological matrices at low microgram-to-nanogram input5. In parallel, antibody-free bead-based enrichment strategies have emerged that compress protein dynamic range by selective protein capture on physiochemically functionalized beads, enabling identification of low-abundance proteins from small, neat volumes of plasma and other biological fluids without immunodepletion6.
Here we apply a bead-based protein enrichment workflow coupled to DIA mass spectrometry to the analysis of human CSF. Eight single-donor CSF specimens from Alzheimer’s patients, stratified by clinical glucose measurement, were processed in parallel using a standard in-solution iST workflow (PreOmics) and a bead-based ENRICH-iST workflow (PreOmics) on matched starting material. Peptides were analyzed in DIA mode on an Orbitrap Excedion Pro mass spectrometer coupled to a Vanquish Neo ultra-high performance liquid chromatography (UHPLC) system. Differential protein abundance between the two glucose strata was characterized in the enriched preparation, and the resulting protein sets were placed in functional context by gene ontology over-representation analysis.
Methods
Samples
Eight de-identified human Alzheimer’s CSF specimens (Discovery Life Sciences) were used in this study. Four specimens had clinical glucose measurements below the laboratory reference range (50 – 80 mg/100 mL) and four had glucose measurements above the reference range. Sample selection was performed without regard to underlying clinical indication; specimens were drawn from the supplier inventory using glucose stratification as the sole selection criterion, however, matching of clinical characteristics such as age, gender, and race was performed where possible.
Sample preparation
Each CSF specimen was split into two aliquots. The first aliquot (10 µL) was processed using the iST kit (PreOmics) following the manufacturer’s standard protocol. Briefly, single-step denaturation, reduction, and alkylation was performed, followed by enzymatic digestion with a trypsin/LysC mixture and C18 spin-column cleanup of the resulting peptides. The second aliquot (200 µL) was processed using the ENRICH-iST kit (PreOmics) including incubation with EN-BIND buffer and pre-washed paramagnetic EN-BEADS, magnetic capture, three on-bead washes, on-bead denaturation/reduction/alkylation, on-bead trypsin/LysC digestion, and C18 cleanup. Peptides from both workflows were dried and stored at −80°C until LC-MS analysis.
LC-MS/MS analysis
Dried peptides were reconstituted in 16 µL 4% ACN/0.1% formic acid, quantified using the Pierce Quantitative Fluorometric Peptide Assay (Thermo Fisher Scientific), and 200 ng of each sample was injected in technical duplicate, yielding 32 LC-MS injections in total (8 specimens × 2 preparations × 2 technical replicates). LC separation was performed on a Vanquish Neo UHPLC system (Thermo Fisher Scientific) equipped with a 75 µm × 500 mm EASY-Spray PepMap Neo column (Thermo Fisher Scientific), using a 75-minute gradient from 4% to 80% acetonitrile in 0.1% formic acid. The eluate was directed to an Orbitrap Excedion Pro mass spectrometer (Thermo Fisher Scientific) equipped with the EasySpray NG source operated in data-independent acquisition (DIA) mode. Method settings were set to collision energy of 28%, 30,000 resolution, and a scan range of 380-980 m/z with 8 m/z isolation windows, overlapping 1 m/z.
Data analysis
DIA raw files were processed in Spectronaut (Biognosys, version 20.5.260227.92449) and searched against a predicted Homo sapiens spectral library generated from the UniProt reference proteome FASTA (retrieved 30 January 2026) using DirectDIA+, a library free search method, with an FDR of 0.01, fixed carbamidomethyl modification, variable acetyl (N-term), and oxidation modifications. Protein group identifications and label-free quantification were also performed in Spectronaut. Downstream statistical comparisons were performed in GraphPad Prism (Dotmatics, version 10.5.0). Differential abundance analysis between the high- and low-glucose cohorts was performed on the enriched preparation only. Gene ontology over-representation analysis for the Biological Process and Molecular Function categories was performed using the Gene Ontology Enrichment Analysis tool powered by the Protein Analysis Through Evolutionary Relationships (PANTHER) classification system (PANTHER 19.0)7. A schematic of the complete workflow is shown in Figure 1.
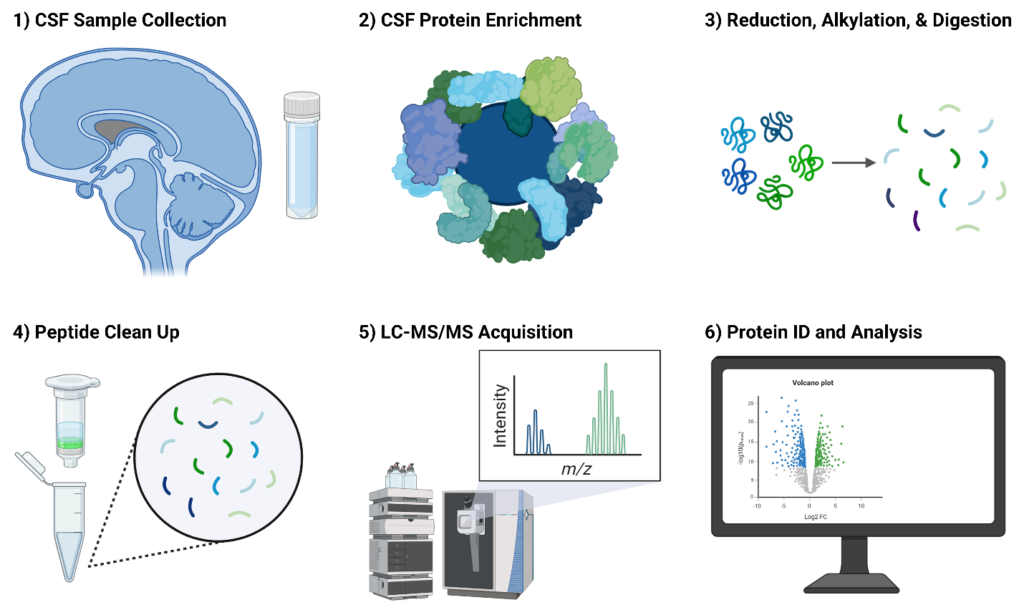
Figure 1. Schematic overview of the CSF discovery proteomics workflow. CSF specimens are collected and split into two aliquots. One aliquot is processed using a standard in-solution iST kit (PreOmics, neat preparation) and the other using a bead-based ENRICH-iST kit (PreOmics, enriched preparation). Both aliquots undergo reduction, alkylation, and trypsin/LysC digestion, followed by peptide clean-up. Peptides are analyzed by LC-MS/MS on a Vanquish Neo UHPLC coupled to an Orbitrap Excedion Pro mass spectrometer operating in DIA mode. DIA raw files are searched against a predicted Homo sapiens spectral library, and downstream statistical and functional analyses are performed in GraphPad Prism and the Gene Ontology Enrichment Analysis tool, respectively.
Results
Bead-based enrichment increases protein group identifications across all donors
Across all eight donors, the bead-based ENRICH-iST workflow identified more protein groups than the parallel neat preparation from the same specimen (Figure 2). Across the cohort, the neat preparation identified an average of 945protein groups per sample, while the enriched preparation identified an average of 1732protein groups per sample, corresponding to an approximate 1.85 – fold increase in proteome depth at a fixed peptide loading of 200 ng. The gain was reproducible across all eight donors and across both clinical glucose strata, and technical replicate variability was low for both workflows. No specimen failed to show an increase under the enriched preparation, and the increase was achieved without offline fractionation or immunodepletion of high-abundance carrier proteins.
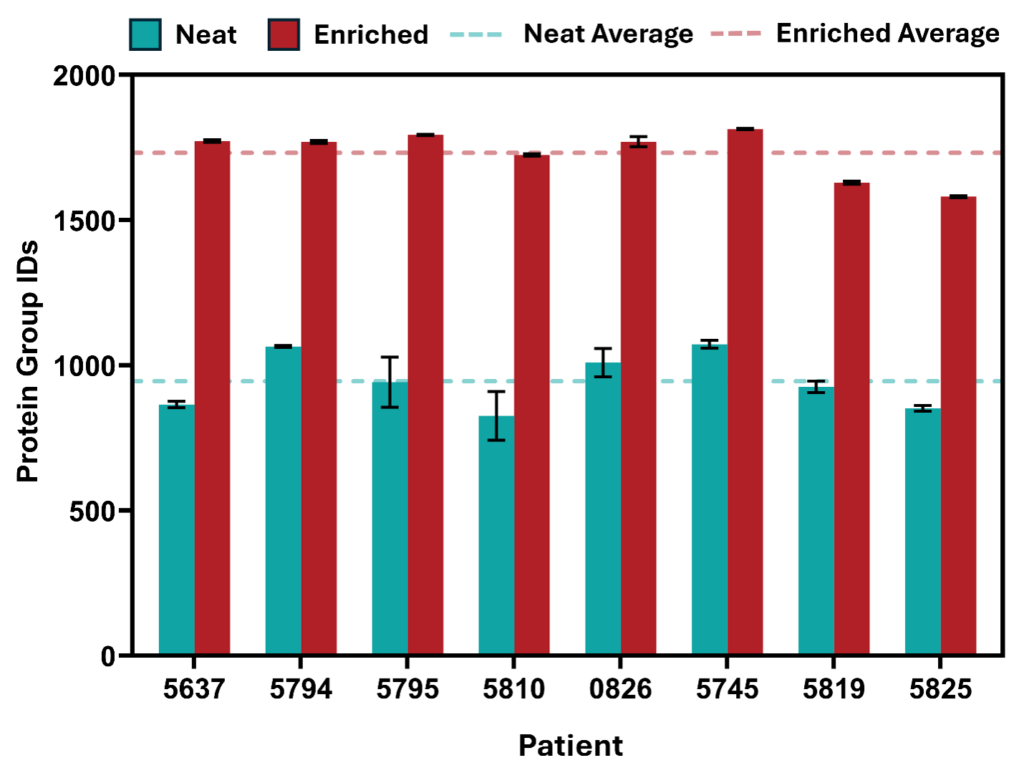
Figure 2. Protein group identifications by sample preparation method. Bars represent the mean number of protein group identifications across technical replicate injections (n = 2) for each donor sample (n = 8), prepared using either the neat iST workflow (teal) or the bead-based ENRICH-iST workflow (red). Error bars indicate the standard deviation between technical replicates. Dashed lines represent the cohort-wide average number of protein groups identified per sample for each preparation method (neat average = 945; enriched average = 1732). The enriched workflow yielded a 1.85 – fold improvement in protein group identifications on average and reproduced this gain in every donor in the cohort.
Differential abundance analysis between glucose strata
Differential abundance analysis between the four high-glucose and four low-glucose donors was performed on the enriched preparation (Figure 3). 179 proteins were significantly elevated in the high-glucose cohort and 268 proteins were significantly elevated in the low-glucose cohort. Among the top hits by combined fold change and significance, ACAN, PEBP4, PAPLN, CKM, HRG, CRIPTO, GFRA3, KIF13A, and the immunoglobulin variable-region products IGLV8-61 and IGHV5-10-1 were elevated in the high-glucose group, while PLA2G7, C1RL, HYAL1, MERTK, MRC1, MYL1, ACP1, TFRC, EHBP1L1, and EPHB2 were elevated in the low-glucose group. Differentially abundant proteins spanned a broad fold-change range in both directions, with several candidates separated by more than two log2 units between the two strata.
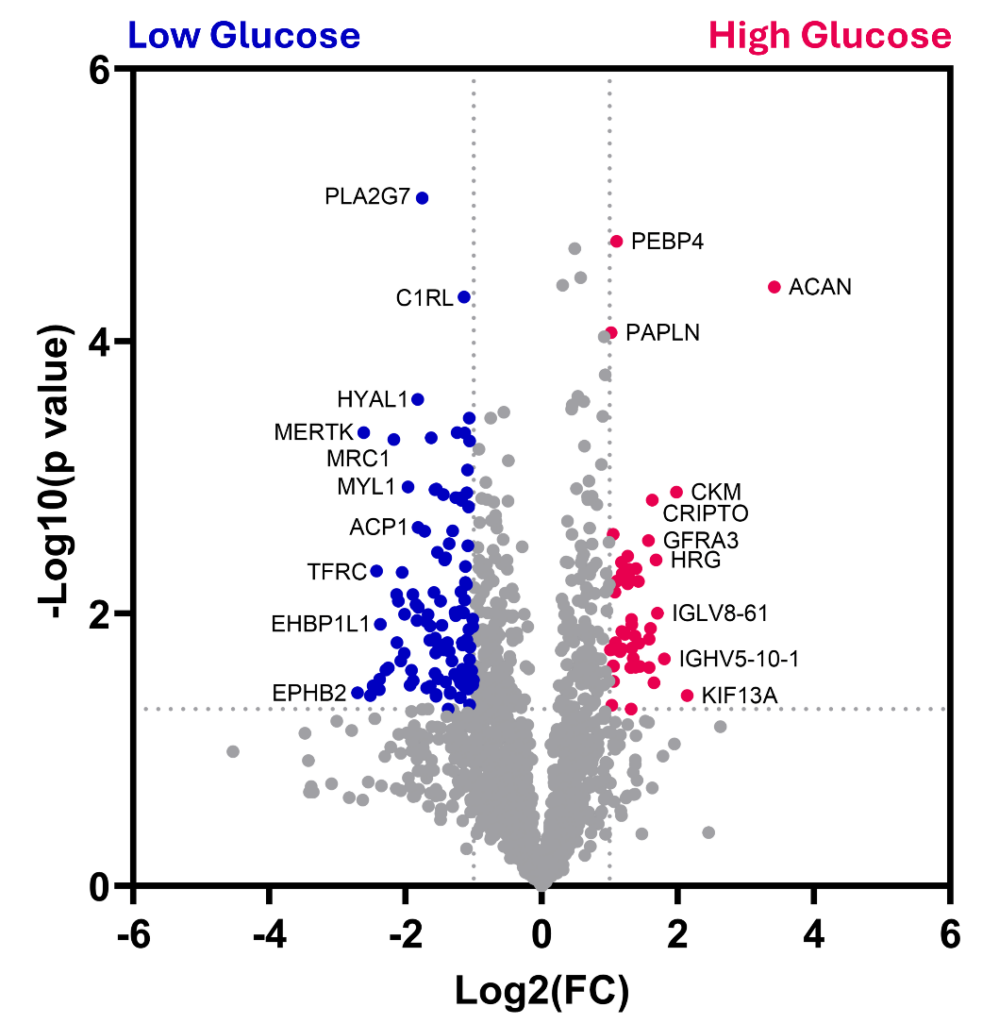
Figure 3. Differential abundance analysis between high-glucose and low-glucose CSF donors using the enriched preparation. Volcano plot of −log10(p value) versus log2(fold change) for protein groups quantified in both cohorts (high glucose n = 4, low glucose n = 4; enriched preparation only). Dotted lines mark the significance thresholds applied (p ≤ 0.05 and |log2 FC| ≥ 1). Proteins meeting both thresholds are colored pink (elevated in high-glucose) or blue (elevated in low-glucose); the top ten proteins by combined fold change and significance in each direction are labeled by gene symbol. The neat preparation was not included in this comparison.
Gene ontology enrichment recovers distinct biological themes within each stratum
To place the differentially abundant proteins in functional context, gene ontology over-representation analysis was performed on the up-regulated protein set within each cohort, and the most strongly enriched Biological Process and Molecular Function terms were visualized (Figure 4). Proteins elevated in the high-glucose cohort were enriched for terms related to extracellular structure and humoral immunity, including extracellular matrix organization, external encapsulating structure, complement activation, extracellular matrix structural constituent, glycosaminoglycan binding, and heparin binding. Proteins elevated in the low-glucose cohort were enriched for terms related to cell adhesion, motility, and neural projection biology, including cell adhesion, regulation of cell migration, axon guidance, neuron projection guidance, signal receptor binding, and cell adhesion molecule binding. Within each plot, marker area reflects the number of proteins driving the enrichment and marker color reflects the magnitude of fold enrichment.
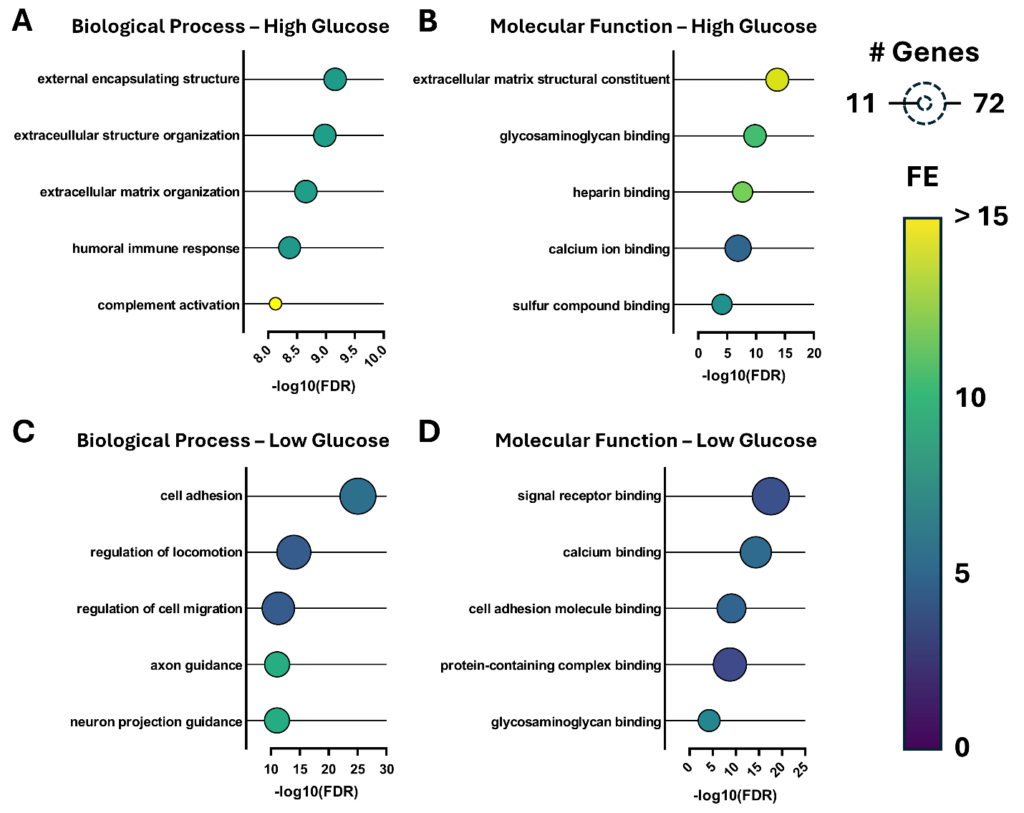
Figure 4. Gene ontology over-representation analysis for proteins differentially elevated in each glucose cohort. Top enriched terms for Biological Process (A, C) and Molecular Function (B, D) within the high-glucose (A, B) and low-glucose (C, D) cohorts. The x axis shows −log10(false discovery rate), marker diameter reflects the number of proteins contributing to each term, and marker color reflects the magnitude of fold enrichment (FE) according to the legend at right. Analyses were performed on the up-regulated protein set from each cohort identified in the enriched preparation (see Figure 3).
Discussion
The average 1.85 – fold gain in protein group identifications observed with ENRICH-iST relative to a matched neat preparation (Figure 2) is consistent with the underlying principle of dynamic range compression where selective on-bead capture removes a portion of the most abundant carrier proteins to the supernatant while retaining a broader population of lower-abundance proteins on the bead surface, allowing the MS duty cycle to sample a wider portion of the proteome at equivalent peptide loading6. The magnitude of the gain and its consistency across all eight donors track with previously reported performance of bead-based enrichment in plasma and other low-protein biological fluids.
The differentially abundant proteins recovered from each stratum (Figure 3) and the gene ontology terms they define (Figure 4) sketch internally coherent biological signatures. Proteins elevated in the high-glucose cohort are dominated by extracellular matrix constituents (ACAN, PAPLN), heparin- and glycosaminoglycan-binding proteins, and humoral immunity components, including immunoglobulin variable-region gene products (IGLV8-61, IGHV5-10-1) and proteins associated with complement activation. The plasma protein HRG and the muscle isoform of creatine kinase (CKM) also appear in this set. Taken together, this composition is consistent with a relative enrichment of plasma-derived and matrix-remodeling activity in the high-glucose stratum, a pattern that has been associated in prior CSF studies with altered blood-brain barrier permeability and an attendant influx of plasma and complement proteins into the CSF compartment8. Proteins elevated in the low-glucose cohort, in contrast, are enriched for cell-adhesion molecules, ephrin and neurotrophic factor receptor family members (EPHB2, MERTK, GFRA3), and gene ontology terms related to axon guidance and neuron projection. This composition is more consistent with a parenchymal or cell-surface neural origin, and may reflect ongoing neural cell remodeling, synaptic turnover, or shedding of neuronal surface proteins into the CSF9.
Several technical observations are worth noting. Technical replicate variability was low for both workflows (Figure 2), and per-donor variability under the enriched preparation was comparable to that of the neat preparation. The proteome depth observed in the enriched arm was obtained from a single 75-minute gradient on a single 200 ng injection per replicate, without offline fractionation or immunodepletion, placing the per-sample timeframe within the range typically required for cohort-scale studies. Throughput considerations aside, the use of bead-based enrichment over immunodepletion preserves some carrier proteins such as albumin and the immunoglobulins in the analyzed sample, which can themselves carry information of interest and which serve as the physiological vehicle for many low-abundance binders.
Conclusion
We applied a bead-based protein enrichment workflow coupled to DIA mass spectrometry on the Orbitrap Excedion Pro platform to a small set of human CSF specimens stratified by clinical glucose measurement. The enriched preparation produced an average 1.85 – foldincrease in protein group identifications relative to a matched non-enriched preparation, with low technical variability and a consistent gain across all eight donors. Differential abundance analysis between the two glucose strata recovered functionally distinct protein signatures — an extracellular matrix and humoral immunity signature in the high-glucose stratum, and a cell adhesion and neural projection signature in the low-glucose stratum — suggestive of differences in the relative contribution of plasma- and parenchyma-derived proteins between the two groups. Extension of this analytical approach to disease-defined cohorts of larger size, evaluation of alternative acquisition strategies and gradient lengths, integration with paired plasma proteomics for cross-fluid biomarker validation, or development of targeted proteomic assays to measure proteins of interest are natural next steps.
References
- Czarniak N, Kamińska J, Matowicka-Karna J, Koper-Lenkiewicz OM. Cerebrospinal Fluid-Basic Concepts Review. Biomedicines. 2023;11(5):1461. Published 2023 May 17. doi:10.3390/biomedicines11051461.
- Pingle SC, Lin F, Anekoji MS, et al. Exploring the role of cerebrospinal fluid as analyte in neurologic disorders. Future Sci OA. 2023;9(4):FSO851. Published 2023 Apr 4. doi:10.2144/fsoa-2023-0006.
- Schutzer SE, Liu T, Natelson BH, et al. Establishing the proteome of normal human cerebrospinal fluid. PLoS One. 2010;5(6):e10980. Published 2010 Jun 11. doi:10.1371/journal.pone.0010980.
- Schilde LM, Kösters S, Steinbach S, et al. Protein variability in cerebrospinal fluid and its possible implications for neurological protein biomarker research. PLoS One. 2018;13(11):e0206478. Published 2018 Nov 29. doi:10.1371/journal.pone.0206478.
- Kitata RB, Yang JC, Chen YJ. Advances in data-independent acquisition mass spectrometry towards comprehensive digital proteome landscape. Mass Spectrom Rev. 2023;42(6):2324-2348. doi:10.1002/mas.21781.
- Borràs E, Anastasi F, Pastor O, Suárez-Calvet M, Sabidó E. Enhanced proteome profiling of human cerebrospinal fluid using a commercial plasma enrichment strategy. J Proteomics. 2026;324:105575. doi:10.1016/j.jprot.2025.105575.
- Thomas PD, Ebert D, Muruganujan A, Mushayahama T, Albou LP, Mi H. PANTHER: Making genome-scale phylogenetics accessible to all. Protein Sci. 2022;31(1):8-22. doi:10.1002/pro.4218.
- Negro-Demontel L, Maleki AF, Reich DS, Kemper C. The complement system in neurodegenerative and inflammatory diseases of the central nervous system. Front Neurol. 2024;15:1396520. Published 2024 Jul 3. doi:10.3389/fneur.2024.1396520.
- Waldera-Lupa DM, Etemad-Parishanzadeh O, Brocksieper M, et al. Proteomic changes in cerebrospinal fluid from primary central nervous system lymphoma patients are associated with protein ectodomain shedding. Oncotarget. 2017;8(66):110118-110132. Published 2017 Nov 24. doi:10.18632/oncotarget.22654.